
The Report Page provides you with in-depth insights into the performance of your wishlist and how it contributes to your store’s overall revenue. Here, you can view essential data about your users, wishlist items, and the revenue generated from wishlist interactions, allowing you to make informed, data-driven decisions to optimize your business strategy.
User Reports: Track User Behavior and Engagement #
The User Reports section gives you a comprehensive look at how users are interacting with your wishlist. By reviewing this report, you can gain insights into the behaviors and preferences of your customers, helping you understand which items are gaining attention and how they engage with your store.
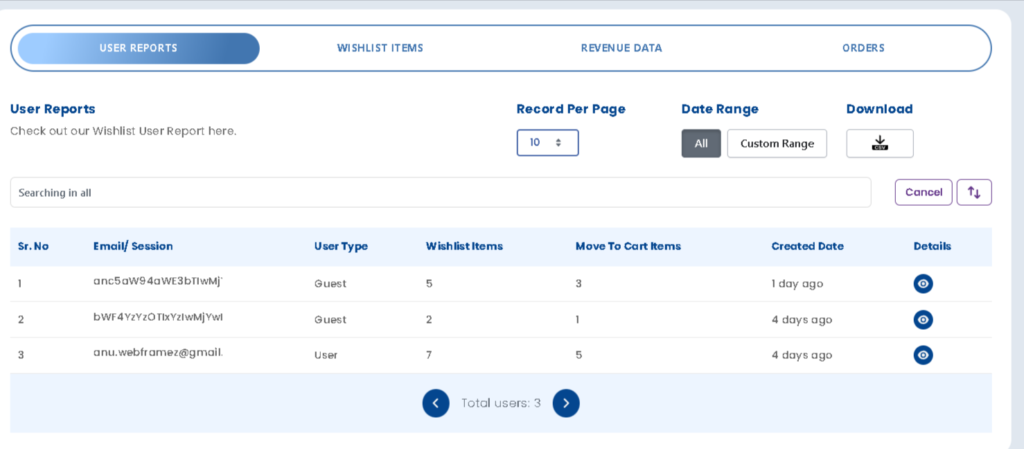
Filter and Export User Reports #
The User Reports tab includes powerful filtering and export options that help you analyze wishlist activity, identify engaged shoppers, and download reports for further analysis.
- Record Per Page: This allows you to specify how many user records are displayed per page for easier navigation.
- Date Range: You can filter the data by specific date ranges to analyze activity over time.
- Email/Session: Track the user’s email or session information for a better understanding of their activity on your site.
- User Type: Identify whether users are logged-in members or guests, helping you differentiate between new and returning customers.
- Wishlist Items: See how many items a user has added to their wishlist, giving you insight into customer interests.
- Move to Cart Items: View how many items from the wishlist have been moved to the cart, showing user intent to purchase.
- Created Date: View when the user account was created to gauge how recently they joined your store.
- Details: Access further details about each user’s activity and interactions with the wishlist.
- Export User Reports: Click the Download (CSV) button to export the filtered report.
- The exported file includes the same data currently displayed in the report, making it easy to:
- Share reports with your team
- Perform advanced analysis in Excel or Google Sheets
- Keep historical records of wishlist activity
Wishlist Items: Track Product Popularity and Interest #
The Wishlist Items section lets you monitor the specific items that users are adding to their wishlists. This is an invaluable tool for identifying popular products and trends, allowing you to prioritize marketing efforts and inventory management based on customer interest.
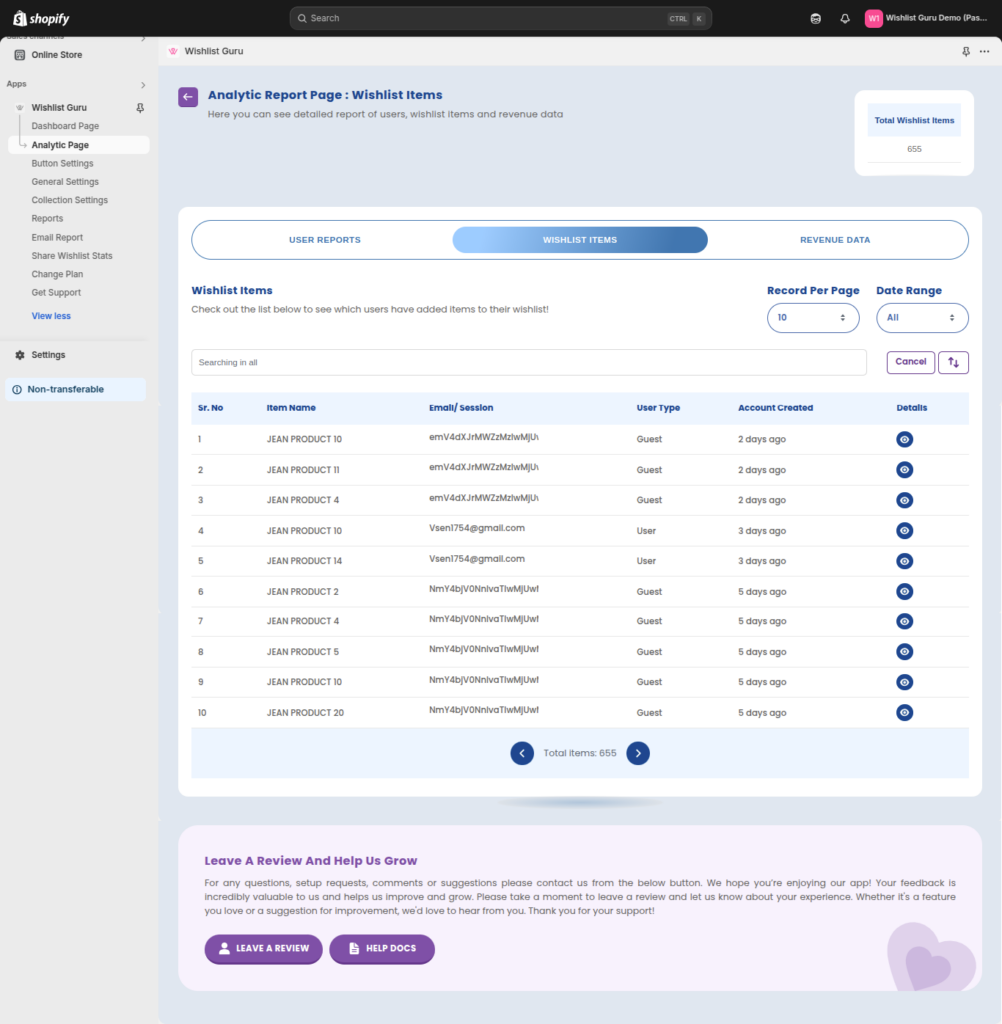
In this section, you’ll see:
- Record Per Page: Select how many records are shown per page for convenience.
- Date Range: Filter wishlist data by specific time periods to assess changes in customer preferences.
- Item Name: The name of the product added to the wishlist.
- Email/Session: The user’s email or session, which helps link specific wishlists to individual users.
- User Type: Understand whether the item was added by a guest or registered user.
- Account Created: The date the user’s account was created, helping you track new versus returning customers.
- Details: Access additional details about each user’s wishlist activity.
Revenue Data: Monitor Wishlist Items Added to Cart #
The Revenue Data report shows wishlist products that customers have moved to their cart. It helps you identify which wishlist items are generating purchase intent before an order is placed.
Why it matters
- Understand which wishlist items encourage customers to start the checkout process.
- Measure wishlist-to-cart conversions.
- Identify products with high buying intent.
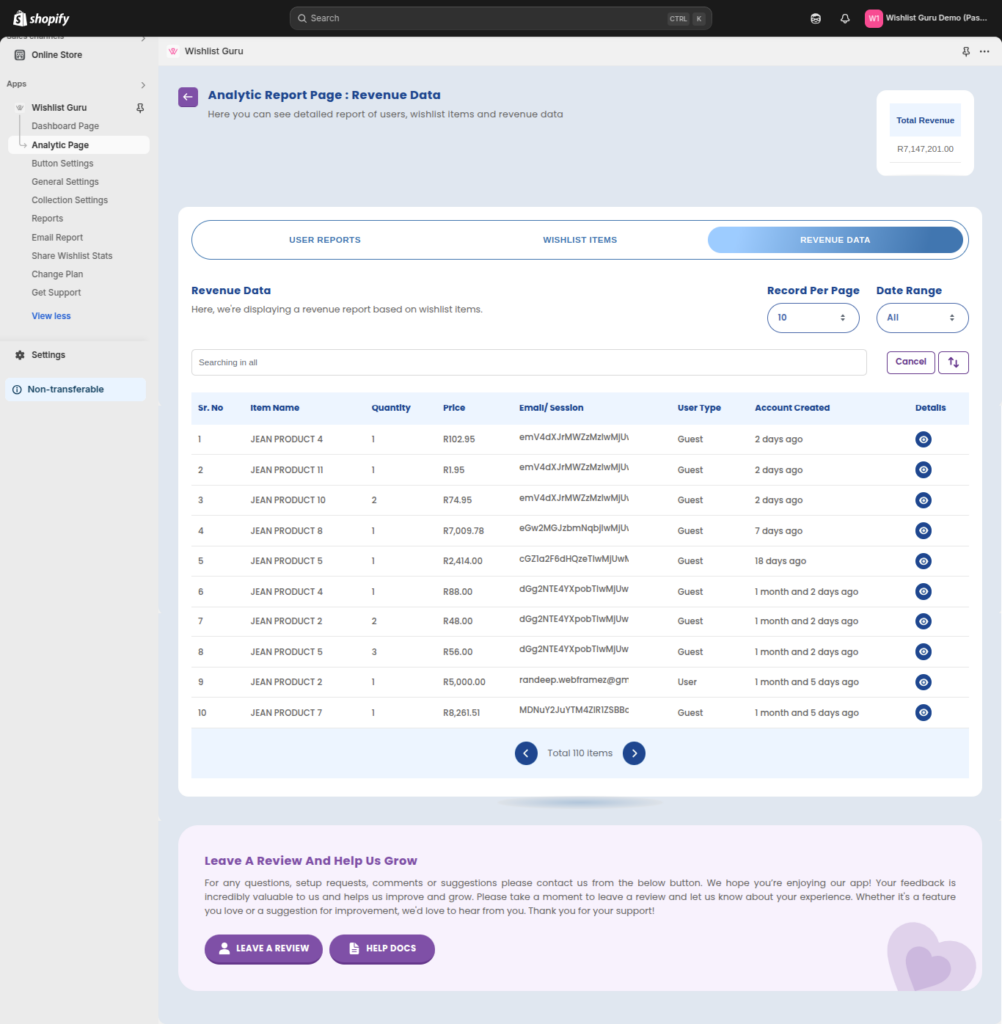
In this section, you’ll see:
- Record Per Page: Control how many revenue records are displayed per page for easier navigation.
- Date Range: Set specific date ranges to understand sales patterns over time.
- Item Name: The name of the product purchased, helping you identify which wishlist items are driving sales.
- Quantity: The number of units sold from the wishlist item.
- Price: The price of each item, providing insight into revenue per product.
- Email/Session: The user’s email or session details to track who made the purchase.
- User Type: See whether the sale came from a new customer or a returning shopper.
- Account Created: The date the user account was created, helping to analyze purchases from new versus established customers.
- Details: View additional information about the revenue generated from each wishlist item.
Orders: Track Completed Orders from Wishlist Items #
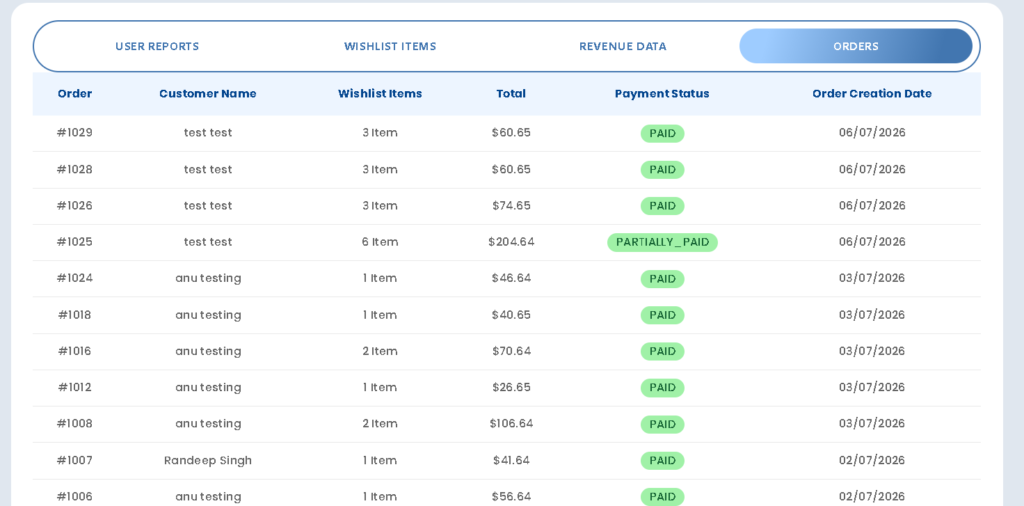
The Orders report displays completed Shopify orders that include products previously added to a customer’s wishlist. This report helps you track how wishlist activity converts into actual sales.
Why it matters
- Track wishlist-to-order conversions.
- Measure sales generated from wishlist products.
- Monitor payment status and completed purchases.
- Understand the business impact of your wishlist feature.
Make Better Business Decisions with Wishlist Reports #
The Report Page in Wishlist Guru helps you understand how customers interact with your wishlist and how those interactions contribute to your store’s sales. From tracking user engagement and identifying your most popular wishlist products to monitoring wishlist items added to cart and completed purchases, these reports provide actionable insights that help you improve marketing campaigns, optimize inventory, and increase conversions.
Review your reports regularly to identify high-intent products, measure wishlist performance, and understand the true impact of your wishlist feature on revenue.
Frequently Asked Questions #
#
Wishlist Guru tracks products that customers first added to their wishlist and later moved to the cart. If those products are eventually purchased, they are included in your wishlist analytics and revenue reports.
#
Revenue Data shows wishlist products that customers moved from their wishlist to the shopping cart, helping you measure purchase intent.
Orders shows completed Shopify orders that contain products previously added to a wishlist, allowing you to measure actual conversions and revenue generated from wishlist activity.
#
Yes. You can filter reports using predefined date ranges including:
- Today
- Yesterday
- This Week
- Last Week
- This Month
- Last Month
This makes it easy to compare customer behavior over different periods.
#
Yes. The Wishlist Items report shows which products customers save most frequently, helping you identify trending products and plan promotions or inventory accordingly.
#
Yes. Depending on whether the customer is logged in or browsing as a guest, Wishlist Guru displays either the customer’s email address or session information, along with their wishlist activity.
#
Yes. Wishlist Guru tracks activity for both registered customers and guest visitors, allowing you to understand wishlist behavior across all shoppers.
#
Yes. The Orders report lets you see completed purchases that include wishlist items, making it easier to understand how your wishlist contributes to store revenue and conversions.
#
- User Reports — Understand customer engagement and wishlist activity.
- Wishlist Items — Discover your most popular products.
- Revenue Data — Monitor wishlist items moved to the cart.
- Orders — Track completed purchases generated from wishlist products.


