
The Analytics Report Page is an invaluable tool that allows you to track and evaluate the performance of your wishlist app. This feature offers a comprehensive overview of key metrics, providing insights into user behaviour, wishlist trends, and revenue generation. By analysing this data, you can make informed decisions to optimise your wishlist strategy and ultimately drive more sales.
Where to Find Reports #
- Open the Wishlist Guru app from your Shopify admin.
- Go to the Left sidebar and select Analytic Page
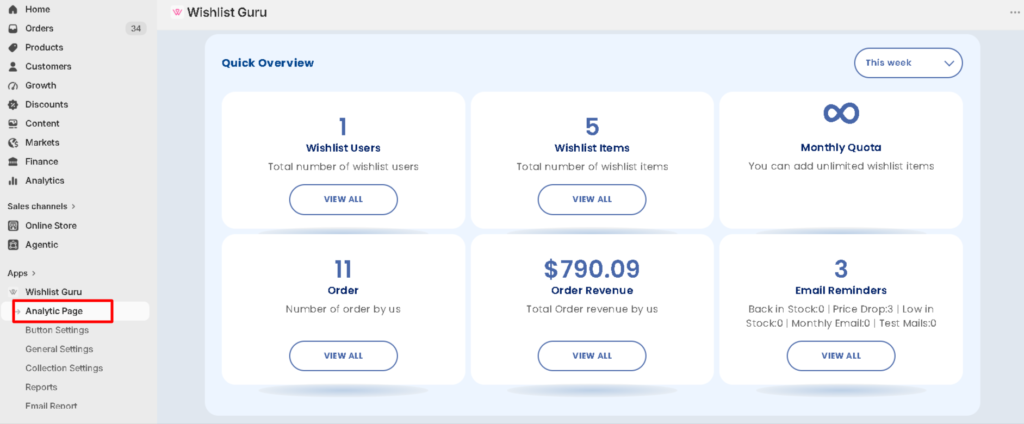
At the top of the Analytics Report Page, you’ll find a Quick Overview section that highlights the most important statistics related to your wish list app. This snapshot provides a fast and easy way to know how well your wishlist is performing.
- Wishlist Users: This number reflects the total number of users who have interacted with your wishlist app. It gives you insight into your customer base and helps you understand the popularity of your wishlist feature.
- Wishlist Items: Here, you’ll see the total number of items that have been added to wishlists across all users. This helps you gauge which products are attracting the most attention from your customers.
- Total Revenue: The total revenue is calculated based on the items that have been moved from the wishlist to the cart and eventually purchased. This metric helps you understand how wishlist items are contributing to your sales and which products are most likely to convert into purchases.
- The Monthly Quota section allows you to monitor how many wish list items your store is currently using within a given month. You can track your progress against any set limits according to the plan chosen, ensuring you stay within your preferred usage for each month.
- Order: Tracks the total number of orders placed for products that were previously added to a customer’s wishlist.
- Order Revenue: Shows the total revenue generated from orders containing products that customers previously added to their wish list.
01. Filter Analytics by Date Range #
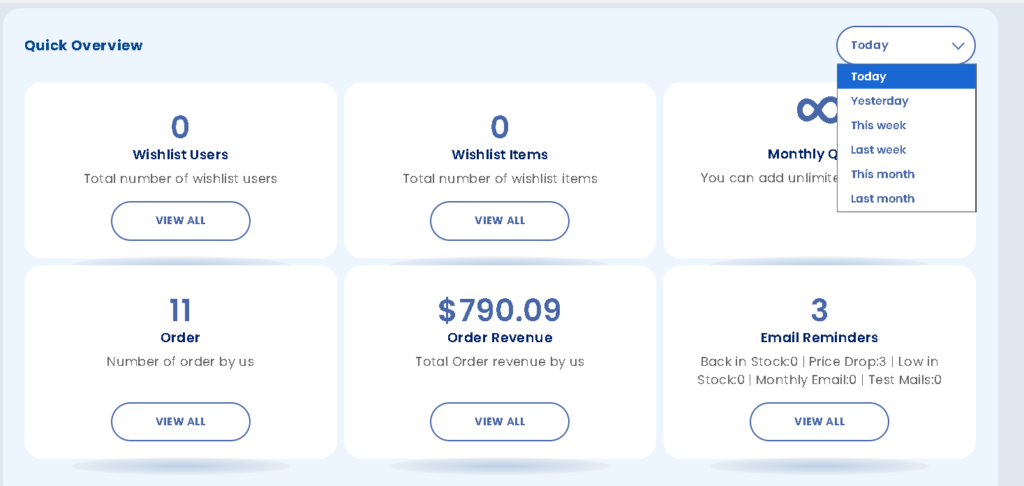
Use the date filter in the top-right corner of the Analytics page to view your wishlist performance for a specific period.
You can filter analytics by:
- Today
- Yesterday
- This Week
- Last Week
- This Month
- Last Month
All analytics cards—including Wishlist Users, Wishlist Items, Orders, Order Revenue, and Email Reminders—will automatically update based on the selected date range, helping you analyse customer engagement and sales performance over different time periods.
02. Graphical Representation #
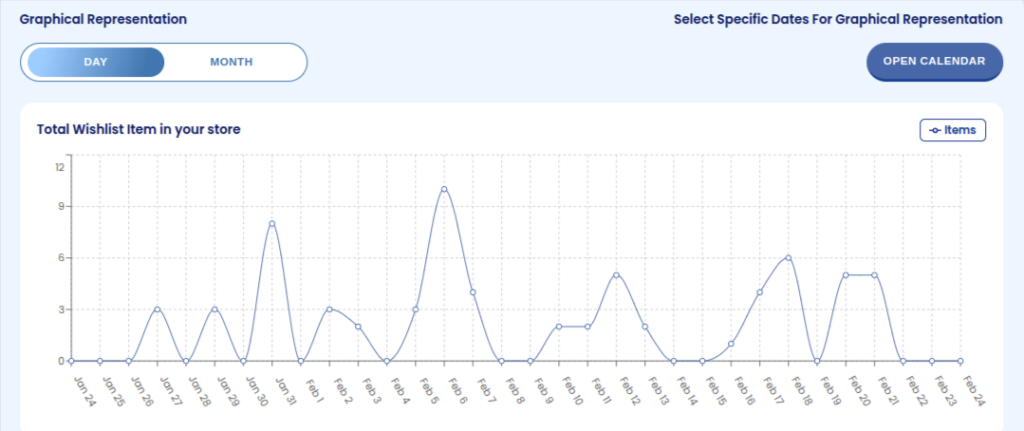
Next is the wishlist graph, which is further divided into
- The data shown in the image below reveals the Wishlist item chart of a day, explaining the no. of items being added to the wishlist, and the second graph shows the no. of wishlist users on that current day. The same goes for the month data: when you click on the month button (labelled as ‘1’), it shows the no. of items added by the users in the wishlist app and the no. of users in that particular month (labelled as ‘point 2’ and ‘point 3’, respectively).
03. Top and Recently Added Item #
Lastly, the analytic page displays the most wished-for products and recently added products and a view all button along with the images of the products.
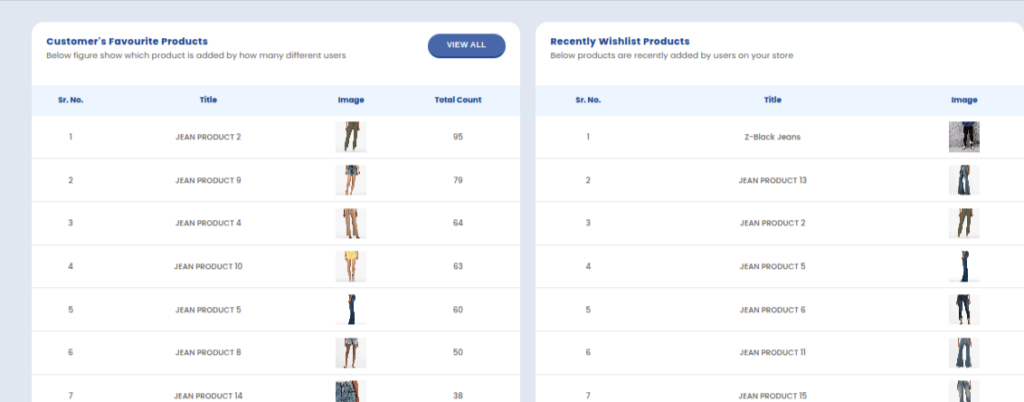
The “Most Wishlist Product” tab in the admin interface allows the admin user to see the products that are included on the most wish lists.
“Recently Added Products” shows the new and the most recent products that are added by the users.
The “View All” button shows all the products that are present in the most wishlisted products.
With access to detailed reports on wishlist users, items, total revenue, and graphical representations of your data, you can gain deep insights into how your wishlist app is performing and make data-driven decisions to improve your store’s success. Whether you’re looking to optimise your inventory, understand customer preferences, or track your sales performance, the Analytics Report Page provides all the information you need to grow and improve your e-commerce business.


